9.3.5.3 Decadal and longer time-scale variability
A few studies have attempted to look at model-simulated changes in modes of
low-frequency variability due to anthropogenic climate change. Particular attention
has focused on changes in ENSO as reported in the SAR and in Section
9.3.5.2, and the AO or NAO and AAO which are prominent features of low-frequency
variability in the Northern and Southern Hemispheres, respectively (e.g., Fyfe
et al., 1999; Osborn et al., 1999; Paeth et al., 1999; Shindell et al., 1999;
Ulbrich and Christoph, 1999; Zorita and González-Rouco, 2000; Monahan
et al., 2000). It should be noted that these studies have used a variety of
methods for analysing trends in these modes of variability, including indices
based on pressure differentials and principal components (PCs) of hemispheric
sea level pressure (SLP). In addition, these indices are sensitive to changes
in the SLP patterns with time or forcing and so trends must be treated with
some caution. Wallace (2000) finds that in both observations and modelling studies
of increased greenhouse gases, the trends are larger in the PC of SLP than in
the pressure differential indices. Meehl et al. (2000c) show that the changed
base climate state in a future warmer climate could affect the period of global
ENSO-like decadal (10 to 20-year period) variability such that there could be
a shift to longer periods.
Ulbrich and Christoph (1999) find that the NAO index, based on SLP fluctuations
over the North Atlantic in the 300-year control run of their model, shows only
a moderate increase over the length of a 240-year scenario run with increasing
greenhouse gases. The long-term trend exceeds the variability of the control
climate only at the end of the simulation in 2100. In contrast, the steadily
growing storm track activity over north-west Europe already surpasses the standard
deviation defined from the control run after about 160 years. This effect is
associated with a change of the NAO pattern. During the length of the scenario
experiment, empirical orthogonal functions for sequential 10-year periods show
a systematic north-eastward shift of the NAOs northern variability centre
from a position close to the east coast of Greenland, where it is also located
in the control run, to the Norwegian Sea (Figure 9.27)
Osborn et al. (1999) show an initial small increase followed by a decrease
in the NAO index in one model when forced with increases in greenhouse gases
or with greenhouse gases and sulphate aerosols. Paeth et al. (1999) have assessed
changes in both the mean and variance of the NAO on decadal time-scales at quadrupled
CO2-concentrations using an ensemble of four integrations of a single model.
They find a statistically significant increase in the mean NAO index (at the
95% confidence level), especially during late summer/autumn and in winter, suggesting
more westerly and typically milder weather over Europe during the cold season.
However, the increase in the mean NAO index is accompanied by a reduction in
the low-frequency variability of the NAO (Figure 9.28)
(significant at the 5% significance level after 1910) suggesting that the NAO
stabilises in the positive phase. Shindell et al. (1999) found a trend towards
more positive values of the AO index with increased greenhouse gases in a model
which included a representation of the stratosphere, but not in troposphere-only
versions of the same model. They attribute this to the high correlation of the
stratospheric circulation with SLP in the Arctic (e.g., Kitoh et al., 1996;
Kodera et al., 1996).
Figure 9.27: Locations of NAO centres (taken to be the position of
maximum variance as computed from an EOF analysis of sea level pressure
fields) of ECHAM4/OPYC (Ulbrich and Christoph, 1999). The average positions
from the entire control run (using winter means) are marked by black squares,
those of consecutive decades in the scenario run (using all individual months)
are marked by open circles before year 2020 and by black dots thereafter.
|
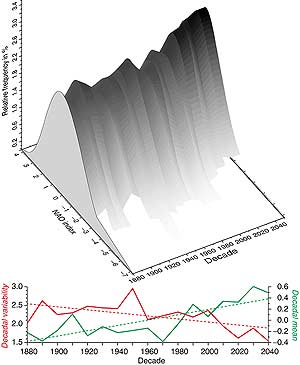
Figure 9.28: Decadal probability density functions (PDF) of the ECHAM3/LSG
transient greenhouse gas ensemble: each PDF (greyscale bars) consists of
160 NAO index realisations including the monthly means of November to February
of the four simulations over one decade. The greyscale background indicates
the relative frequency of the classified NAO indices based on a kernel function
(Matyasovszky, 1998). The PDFs width indicates the decadal variability.
At the bottom, the time-series of the decadal mean (solid green line) and
the variability (solid red line) of each PDF as well as the corresponding
linear trends (dashed lines) are shown (from Paeth et al., 1999). |
In an ensemble of 1900 to 2100 transient integrations with greenhouse gas and
aerosol forcing changes, Fyfe et al. (1999) find a positive trend in the mean
AO and AAO indices. They argue that in their model this is as a result of essentially
unchanged AO/AAO patterns superimposed onto a forced climate change. The result
of Fyfe et al. (1999) suggests that since the mean AO/AAO increases, it might
imply a change to higher-frequency variability, as the positive AO phase has
enhanced westerlies and is typically correlated with above-average storminess.
In a subsequent non-linear analysis by Monahan et al. (2000) of a 1,000-year
control and 500-year stabilisation integration (with greenhouse gas and aerosol
forcing fixed at their year 2100 levels) it is found that (1) in the control
integration the AO is part of a more general non-linear mode of tropospheric
variability which is strongly bimodal and partitions the variability into two
distinct regimes, and (2) in the stabilisation integration the occupancy statistics
of these regimes change rather than the modes themselves.
In summary, there is not yet a consistent picture emerging from coupled models
as to their ability to reproduce trends in climate regimes such as the recently
observed upward trend in the NAO/AO index (Chapters 2
and 12). In addition, whilst several models show an increase
in the NAO/AO index with increased greenhouse gases, this is not true for all
models, and the magnitude and character of the changes vary across models. Such
results do not necessarily suggest that the forced climate change is manifest
as a change in the occurrence of only one phase of these modes of variability.