2.4.2 How Stable was the Holocene Climate?
Ice core, marine and terrestrial records show that the Holocene was marked
by a millennial-scale mode of variability (Meese et al., 1994; OBrien
et al., 1995; Bond et al., 1997; Yiou et al., 1997a,b). These variations affect
both atmospheric (Mayewski et al., 1997) and oceanic (Bianchi and McCave, 1999)
indicators. The occurrence of very large floods in the south-western United
States also reflects substantial low-frequency variability (Ely et al., 1993).
SSTs reconstructed from analyses of a sub-tropical, high sedimentation rate
site off West Africa might indicate a remarkably high amplitude Holocene variability
of 5 to 8°C on a time-scale about 1,500 years (deMenocal, 1998). During
the later Holocene, New Zealand speleothems indicate a lowering of temperature
after about 7 ky BP, with small advances of the mountain glaciers in the Southern
Alps near about 4 and 2.5 ky BP (Salinger and McGlone, 1989). Speleothem records
also indicate a temperature decrease of about 1.5°C some 2 to 3 ky ago (Williams
et al., 1999). These indications are consistent with cooler periods at these
times shown by South African speleothems (Partridge, 1997). By contrast, temperature
peaks appeared in China at about 7 ky BP and at 5.5 to 6 ky BP (Wang and Gong,
2000).
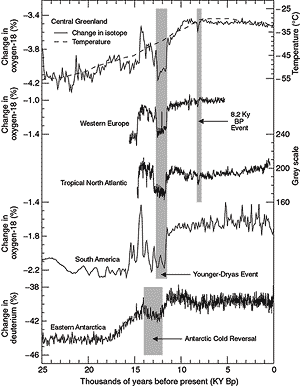
Figure 2.24: Records of climate variability during the Holocene
and the last climatic transition, including the 8.2 ky BP event (adapted
from Johnsen et al., 1992; Hughen et al., 1996; Thompson et al., 1998;
von Grafenstein et al., 1999; Jouzel et al., 2001). The shaded areas
show the 8.2 ky BP event, the Younger Dryas event and the Antarctic
Cold Reversal. The grey scale used in the Tropical North Atlantic
record is a measure of sea surface temperature, deduced from the colour
of plankton rich layers within an ocean sediment core. |
Central Greenland ice cores and European lake isotopic records show correlated
temperature variations within the Holocene, with a roughly 50% higher amplitude
at Summit Greenland, compared to Europe (Figure 2.24).
The most prominent event in both records occurred about 8,200 years BP (Alley
et al., 1997; von Grafenstein et al., 1998; Barber et al., 1999) when annual
mean temperatures dropped by as much as 2°C in mid-Europe and the European
alpine timberline fell by about 200 m (Wick and Tinner, 1999). The event may
be related to a significant decrease of SST in the Norwegian Sea (Klitgaard-Kristensen
et al., 1998). Lake records from the southern border of the Sahara indicate
extremely dry conditions during this time, and probably also during other cool
but less dramatic events of this kind (Street-Perrot and Perrot, 1990 ; Gasse
and Van Campo, 1994). The about 8,200 year cooling may also have been worldwide
(Stager and Mayewski, 1997), although abrupt early Holocene climate changes
recorded in a North American lake are thought to reflect a different event (Hu
et al., 1999). Thus cooling is indicated in the New Zealand Southern Alps, with
small advances of the mountain glaciers at about 8,000 years BP (Salinger and
McGlone, 1989).
Further abrupt climatic changes and reversals on millennial time-scales during
the Holocene are documented from pollen and lake level records e.g., in Europe
(Magny, 1995; Pazdur et al., 1995; Combourieu-Nebout et al., 1998), North Africa
(Gasse et al., 1990; Lamb et al., 1995), North America (Jacobson et al., 1987;
Overpeck et al., 1991) and Australia (Kershaw et al., 1991). Holocene lake level
changes in Europe have been shown to correlate (Magny, 1995; Yu and Harrisson,
1996) with millennial-scale changes in North Atlantic SST and salinity records
(Duplessy et al., 1992; Gasse and van Campo, 1994), suggesting a possible link
between millennial thermohaline circulation variability and atmospheric circulation
over Europe.
The early Holocene was generally warmer than the 20th century but the period
of maximum warmth depends on the region considered. It is seen at the beginning
of the Holocene (about 11 to 10 ky BP) in most ice cores from high latitude
regions e.g., north-west Canada (Ritchie et al., 1989), central Antarctica (Ciais
et al., 1992; Masson et al., 2000) and in some tropical ice cores such as Huascaran
in Peru (Thompson et al., 1995). It is also seen during the early Holocene in
the Guliya ice core in China (Thompson et al., 1998) but not in two other Chinese
cores (Dunde, Thompson et al., 1989; and Dasuopu, to be published). North Africa
experienced a greatly expanded monsoon in the early and mid-Holocene, starting
at 11 ky BP (Petit-Maire and Guo, 1996), and declining thereafter. In New Zealand
the warmest conditions occurred between about 10 to 8 ky BP, when there was
a more complete forest cover than at any other time. Glacial activity was at
a minimal level in the Southern Alps and speleothem analyses indicate temperatures
were about 2°C warmer than present (Salinger and McGlone, 1989; Williams
et al., 1999).
By contrast, central Greenland (Dahl-Jensen et al., 1998), and regions downstream
of the Laurentide ice sheet, did not warm up until after 8 ky BP (including
Europe: COHMAP Members, 1988; eastern North America: Webb et al., 1993). The
East Asian monsoon did not commence its expanded phase until after 8 ky BP (Sun
and Chen, 1991; Harrison et al., 1996; Yu and Qin, 1997; Ren and Zhang, 1998).
A more detailed description of the climate at 6 ky BP as well as of the mechanisms
involved is given in Chapter 8. Long-term climate changes
during the Holocene are consistent with the effects of orbital forcing, modified
by the persistence of the Laurentide ice sheet (which finally disappeared around
6 ky BP).
Seasonal to interannual climate variability may also have varied its character
during the Holocene. This is a period for which a variety of palaeo-proxies
and archaeological investigations (e.g., Sandweiss et al., 1996; Rodbell et
al., 1999) provide evidence for past variations in the strength and frequency
of ENSO extremes. A 16-year long time-series of temperature and hydrological
balance from a coral dated at 5,370 years BP from the Great Barrier Reef (Gagan
et al., 1998) implies that ENSO, or its teleconnections to Australia, were substantially
different in the mid-Holocene than today. Mid-Holocene changes in the spectrum
of ENSO variability have also been implicated by sedimentary palaeoclimatic
records in Australasia (McGlone et al., 1992; Shulmeister and Lees, 1995) and
South America (Sandweiss et al., 1996; Rodbell et al., 1999).
To sum up, the Holocene shows both long-term trends (including changes in the
nature of ENSO) and millennial time-scale variability although the amplitude
of the variability is small compared with that characteristic of Ice Ages. As
more detailed information becomes available, the timing of the Holocene maximum
warmth is seen to differ across the globe. There appears to be a south to north
pattern, with southern latitudes displaying maximum warming a few millennia
before the Northern Hemisphere regions. Interestingly, the Holocene appears
by far the longest warm stable period (as far as seen from the Antarctic
climate record) over the last 400 ky, with profound implications for the development
of civilisation (Petit et al., 1999).