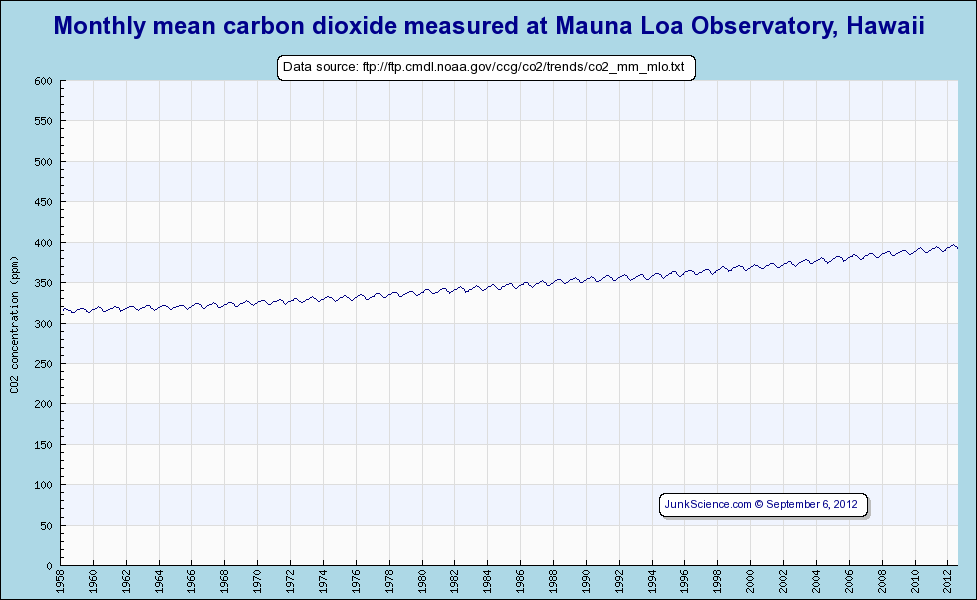
Since 1850, about the time the Industrial Revolution really got underway and when people started seriously trying to monitor and record local temperatures, atmospheric carbon dioxide has risen from about 285 parts per million (ppmv)1 to about 380 ppmv today2. Because various attempts at determining global mean temperature have different origin dates, mileage tends to vary but the IPCC3 quantifies the increase as It is no surprise there is significant disagreement over the amount of warming estimated -- as James Hansen and the Goddard Institute for Space Studies explain7, there is no clear definition of what we mean by absolute surface air temperature and wide variation in the estimated mean surface temperature of the planet. As a consequence of the lack of standardization and the inherent difficulties involved in gathering data from remote locations, the best we can do estimating the global mean temperature (against which we estimate change) is Trends in global temperature are frequently given as "per decade" figures and there is general agreement between the GHCN-ERSST Data Set8 (1880 - 2005): Global Trend: 0.04 °C/decade and HadCRUT2v Data Set9 (1870 - 2005): Global Trend: 0.05 °C/decade, each yielding a result somewhat similar to the IPCC figure above. Whether the high or low bound estimate is more likely to be correct is frequently hotly contested despite the relative enormity of the error margin and so we must look to other measurement methods for clues on the relative merit of the various datasets. Should we believe GHCN-ERSST10? Perhaps we should go with NASA's Goddard Institute for Space Studies GISS Surface Temperature Analysis11 with it's estimate of warming almost twice as large? Data assembled from radiosonde balloon records12 is a pretty fair match with HadCRUT34, GHCN-ERSST8 and HadCRUT2v9, suggesting independent corroboration via alternative methodology. As a further indication, satellite-mounted Microwave Sounding Unit (MSU) data13 matches lower-bound trends moderately well over the period of overlapping data, leaving the GISTEMP6 estimate looking anomalously high. Earth's estimated rate of warming then is approximately one-half of one degree (C) per century (~0.005 °C/year). Not all of this estimated increase is necessarily real since we have been closing rural meteorological stations throughout the satellite era (for reasons of economy since weather forecasting information is available remotely via satellite there is no need to station people in remote locations to make observations) and thus there is an increasing urban bias14 in the record. Even if all of the estimated warming is real it still cannot be solely attributed to increasing atmospheric carbon dioxide. Estimates of net warming from increased carbon dioxide since the Industrial Revolution range from a relative high 0.17 °C15 down to 0.1 °C16. This is a trivial amount of warming when Earth's estimated absolute temperature is ~288 K, roughly 0.06% variation at most and certainly nothing to get excited about. At the same time we have had observable increase in solar contribution, probably accounting for about half the estimated warming of the Twentieth Century17. We have not heard any contention regarding the coincidental cold of the Little Ice Age18 and the Maunder Minimum19, nor the increasing solar activity since20, 21, 22, 23. We know that the warming effect of atmospheric carbon dioxide is logarithmic (meaning each additional unit has less effect than the one preceding) and estimates of warming due to increased carbon dioxide since the Industrial Revolution are really quite small. We know the sun is more active, possibly at its most active since the Holocene Climate Optimum23, 24. We also know the sun has been a significant contributor to our estimated warming15, 16, 17, 20, 21, 22, 23. The carbon emissions from fossil fuel use might have increased global mean temperature by about one-sixth of one degree, so what's with all the fuss about carbon dioxide? Suggested additional reading:
References:
HOMECopyright © 2006 JunkScience.com - All Rights Reserved
|