Table 9.8: Typology of potential international spillovers from mitigation strategies
International spillovers10 arise when mitigation in one country has an impact on sectors in other countries. The main factors are:
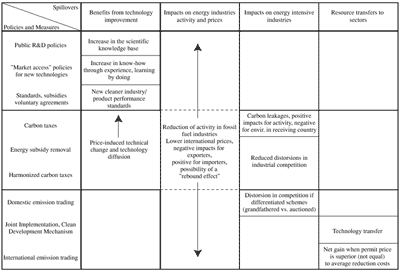
Table 9.8 shows how different policies and measures may give rise to such spillovers. These effects may be included in the design and assessment of policies, particularly in the search for internationally equitable strategies. Chapter 8 considers the macro aspects of spillovers; this section considers the sectoral aspects.
|
Table 9.8: Typology of potential international spillovers from mitigation strategies
|
In the sectoral perspective of this chapter, it appears that there are three routes by which technology policies in one country affect sectoral development in others. First, R&D may increase the knowledge base and this will benefit every country. Second, increased “market access” for low-CO2 technologies, through niche-markets or preferential buyback rates in one country may induce a generic improvement in technology in others. Box 9.1 explains how this process can be modelled. Third, domestic regulations on performance and standards, whether imposed or voluntary can create a strong signal for foreign industrial competitors (Gruber et al., 1997). For example, the ratio of emission standards for carbon monoxide, hydrocarbons, and NOx for automobiles in the EU relative to those in the US has been reduced from a factor of more than 3 in the seventies to a factor 1.5 to 2 in the nineties (Anderson, 1990; IFP, 1998).
|
Box 9.1. International Technological Spillovers in the National Energy Modelling System Model of the US Energy Sector The rate of international spillovers largely depends on the nature of
the technology, the degree of internalization of the market, and the competitive
structure of the industry. The NEMS model of the US energy sector is one
of the rare models explicitly incorporating spillover effects. It is assumed,
based on historical experience, that power plant development outside the
US will also help to decrease costs in the USA. Thus, one unit installed
abroad is incorporated in the experience curve, but only up to a fraction
of the same unit in the USA. The corresponding factor (from 0 to 1) depends
on the proximity of the country and firm developing this power plant.
It gives the measure of the expected international spillover rate (NEMS
model documentation, DOE-EIA; see Kydes, 1999). |
Spillover effects from tax and subsidy policies for mitigation are less direct.
The global economic impacts of the policies are examined, both in a theoretical
and in a modelling perspective, in Chapter 8 (8.3.2.1
to 8.3.2.4). Their impacts on sectors are also analyzed
in section 9.2 above. The sectoral effects of these policies
can be summarized as follows.
The effects of carbon taxation on international competitiveness are reviewed
by Ekins and Speck (1998) and Barker and Johnstone (1998). Clearly, a carbon
tax will raise the cost of production of some sectors of the economy, causing
some consumers to switch from their products to the products of the sectors
in other countries, changing international trade. National losses (and/or gains)
for price competitiveness will be the net sum of the sectors’ losses (and/or
gains) for price competitiveness. The outcome for a particular sector will depend
on the policy instruments used, how any tax revenue has been recycled, and whether
the exchange rate has adjusted to compensate at the national level. The conclusions
from these surveys are that the reported effects on international competitiveness
are very small, and that at the firm and sector level, given well-designed policies,
there will not be significant loss of competitiveness from tax-based policies
to achieve targets similar to those of the Kyoto Protocol.
These conclusions are confirmed by later studies, although in general the effects
of environmental taxation in one country on sectors in other countries are not
well covered by the literature. Using an econometric model (E3ME), Barker (1998a)
assesses policies reducing CO2 emissions in 11 EU member states at
the level of 30 industries and 17 fuel users, comparing unilateral with co-ordinated
policies. The carbon tax reduces imports of oil and increases imports of carbon-intensive
products. However, the results for trade are negligible.
Ban (1998) assesses the effects of an ad-valorem tax on coal (20%), oil (10%),
and gas (10%) using an applied general equilibrium model (GTAP) with 12 world
regions and 14 industry sectors. He has three taxation cases, (a) Japan only,
(b) OECD only, and (c) the world, with revenues used to increase government
expenditure. The results are all shown against a reference case for 1992. Table
9.9 shows the effects on the industrial output in Japan: the effects are
very small when the tax is for Japan only, but they are even smaller when the
taxation is at the OECD or world level, illustrating the size of the competitiveness
effects. These results depend critically on the assumptions adopted as Ban points
out.
| Table 9.9: Effects on sectoral output of Japan (in per cent) of an ad-valorem fuel tax | |||
|
Change of output (%)
|
|||
| Sector |
Japan only
|
OECD
|
World
|
| Agriculture Forestry Mining Oil and coal Chemistry Metal Other manufacture Elec. water, gas Transportation other services Capital goods |
0.0998
0.1744 0.0488 -0.3983 -0.5143 -0.1619 -0.0604 -0.3081 0.0548 0.0349 0.0007 |
0.0646
0.2044 0.1311 -0.1212 -0.3929 -0.1032 -0.0065 -0.3145 0.0480 0.0376 0.0797 |
-0.0295
0.0687 0.1415 0.6689 -0.3884 0.0126 -0.0500 -0.3080 0.0364 0.0364 0.1078 |
| Source: Ban (1998). | |||
There are other aspects to spillovers not well captured in existing models. As energy efficiency is generally higher in Annex B countries than in the rest of the world, some studies suggest that relocation of industry to developing regions would increase global CO2 emissions (e.g., Shinozaki et al., 1998). However, this conclusion would be altered if the relocated industry used up-to-date technologies rather than the average technology in developing countries. The international diffusion of improved technologies in response to CO2 constraints is not captured in existing models and would tend to counteract the negative environmental aspects of spillovers.
|
Other reports in this collection |
|