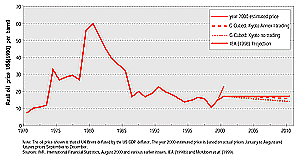
Figure 9.1: Real oil prices 1970 to 2010 and the Kyoto target.
Petroleum and natural gas are discussed in a single section, because they are
often produced in the same countries and marketed by the same companies. In
terms of value, petroleum is the largest single commodity traded on the world
market. Coal, by comparison, is typically used in the country in which it is
produced. Approximately 55% of the oil produced worldwide is exported, compared
with 20% for gas and 12% for hard coal. The three fuels have quite different
patterns of demand and different carbon contents per unit of useful energy.
Global production of crude oil in 1998 totalled 3,516Mt (approx. 147EJ). In
1997, 56% of oil was consumed in the transport sector, up from 42% in 1973 (IEA,
1997b). The emission scenarios in the Intergovernmental Panel on Climate Change
(IPCC) Special Report (Nakicenovic et al., 2000) show a wide range
in demand for oil in 2100, from 0.5EJ in the A2 marker scenario to 248EJ in
the illustrative scenario A1FI. Cumulative oil use between 1990 and 2100 in
scenario A1FI is 29.6ZJ, about 200 times 1998 production, which is close to
the combined conventional and unconventional resource base known today (see
Chapter 3).
Oil is exported by more than 40 countries worldwide with 11 of which are members
of the Organization of Petroleum Exporting Countries (OPEC). OPEC accounts for
76% of world crude oil reserves, 41% of world production and 55% of world exports
(BP Amoco, 1999). On the other hand, around 54% of the world’s downstream
refining capacities are in the OECD, which controls 30% of the world’s
crude production. The petroleum industry is divided into two sectors, the “upstream”
which involves finding and producing crude oil, and the “downstream”
which involves refining crude oil into petroleum products and marketing those
products to end-users. The distinction between OPEC and/or non-OPEC and upstream
and/or downstream aspects of the market and industry is useful in assessing
the impact of mitigation on prices, output and wealth.
The market for crude oil is global, and a reduction in demand will affect all
exporters via the price mechanism. However, the national economic impact of
reduced demand varies greatly depending on the actual cost of production of
crude oil and the degree to which the economies of individual producer countries
are dependent on oil exports. It should be noted that the cost of production
for crude oil can be very different from the market price, which includes royalties
paid to government, transportation costs, and profit. Low-cost producers will
be able to tolerate declines in the price of crude oil better than high-cost
producers will. The more dependent a country is on oil and gas exports, the
more its economy will be impacted if the value of these exports decreases.
Different top-down models have been used to study the effects of CO2
abatement on the oil market4.
Few macroeconomic models have explicitly examined the economic impact of CO2
abatement on energy-exporting countries. Most of the models (OECD’s computable
general equilibrium model (GREEN), OPEC’s world energy model (OWEM), the
IEA model, the international integrated assessment model (IIAM), and Whalley
and Wigle’s model (WW)) cover different world geographic regions or country
groupings.
|
Figure 9.1: Real oil prices 1970 to 2010 and the Kyoto target. |
Wit (1995) surveys such models and concludes that they
should be treated with caution, as hardly any of the global models have been
constructed primarily to examine the economic impact of CO2-abatement
policies on energy exporters. The sensitivity of the parameters used in the
surveyed models is high, which underlines the uncertainties with regard to the
results. In three of the models (OWEM, GREEN, and WW) the CO2-abatement
policies would result in the energy exporters suffering the greatest welfare
losses. (See Chapter 7 for a discussion on welfare losses.)
The cumulative losses of a 1990 CO2 emissions stabilization target
range between 3% to 12% of GDP for energy exporting countries by 2010.
Pershing (2000) also surveys a number of model results for impacts of implementation
of the Kyoto Protocol on oil exporting countries (Table 9.4).
Direct comparison of the model results is difficult, because each model uses
a different measure of impact, and many use different groups of countries in
their definition of oil exporters. However, the studies all show that use of
the flexibility mechanisms will reduce the economic cost to oil producers.
| Table 9.4: Costs of Kyoto Protocol implementation for oil exporting region/countriesa | |||
| Modelb | Without tradingc | With Annex-I trading | With “global trading” |
| G-Cubed GREEN GTEM MS-MRT OPEC Model CLIMOX |
-25% oil revenue -3% real income 0.2% GDP loss 1.39% welfare loss -17% OPEC Revenue N/a |
-13% oil revenue “substantially reduced loss” <0.05% GDP loss 1.15% welfare loss -10% OPEC revenue -10% some oil exporters’ revenues |
-7% oil revenue N/ad N/a 0.36% welfare loss -8% OPEC revenue N/a |
| Source: Pershing (2000) a The definition of oil exporting country varies: for G-Cubed and the OPEC model it is the OPEC countries, for GREEN it is a group of oil exporting coun-tries, for GTEM it is Mexico and Indonesia, for MS-MRT it is OPEC + Mexico, and for CLIMOX it is West Asian and North African oil exporters. b The models are all considering the global economy to 2010 with mitigation according to the Kyoto Protocol targets (usually in the models, applied to CO2 mitigation by 2010 rather than GHG emissions for 2008 to 2012) achieved by imposing a carbon tax or auctioned emission permits with revenues recycled through lump-sum payments to consumers; no ancillary benefits, such as reductions in local air pollution damages, are taken into account in the results. See Weyant (1999). c “Trading” denotes trading in emission permits between countries. d N/a denotes “not available”. |
|||
These and other studies show a wide range of estimates for the impact of GHG mitigation policies on oil production and revenue. Much of these differences are attributable to the assumptions made about: the availability of conventional oil reserves, the degree of mitigation required, the use of emission trading, control of GHGs other than CO2, and the use of carbon sinks. However, all studies show net growth in both oil production and revenue to at least 2020. As Pershing (2000) points out, these studies show significantly less impact on the real price of oil than has resulted from market fluctuations over the past 30 years. This feature (well-established) is illustrated in Figure 9.1. This figure shows the projection of real oil prices to 2010 from the IEA’s 1998 World Energy Outlook (IEA, 1998b) and the effect of implementing the Kyoto Protocol from the G-cubed study (McKibbin et al., 1999, p. 326), the study which shows the largest fall in OPEC revenues in Table 9.4. The 25% loss in OPEC revenues in the non-trading scenario implies a 17% fall in oil prices shown for 2010 in the figure; this is reduced to a fall of just over 7% with Annex B trading.
Continues on next page
|
Other reports in this collection |
|