Climate Change 2001:
Working Group I: The Scientific Basis
Other reports in this collection

5.4.1.3 Comparison of modelled and observed aerosol concentrations

Like previous model intercomparisons, the IPCC comparison showed large differences (factor of 2) in model predictions of the vertical distribution of aerosols. The model simulations of surface sulphate concentrations (Figure 5.8) indicate that much of the difference in sulphate radiative forcing reported in the literature is most likely to be associated with either variations in the vertical distribution or with the response of sulphate aerosols to variations in relative humidity (Penner et al., 1998b).

The IPCC comparison showed that the capability of models to simulate other aerosol components is inferior to their capability to simulate sulphate aerosol. For example, sea salt in the North and South Pacific shows poorer agreement, with an average absoute error of 8 mgm-3 (Figure 5.9) than the corresponding sulphate comparison which is less than 1 mgm-3 (Figure 5.8) (see Table 5.9 also).

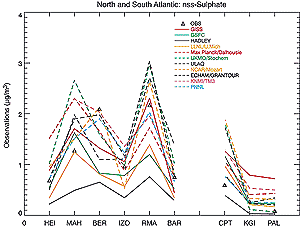
Figure 5.8: Observed and model-predicted annual average concentrations of non-sea salt sulphate (in µgm -3 ) at a series of stations in the North and South Atlantic. The models are listed in Table 5.8. Data were provided by D. Savoie and J. Prospero (University of Miami). Stations refer to: Heimaey, Iceland (HEI); Mace Head, Ireland (MAH); Bermuda (BER); Izania (IZO); Miami, Florida (RMA); Ragged Point, Barbados (BAR); Cape Point, South Africa (CPT); King George Island (KGI); and Palmer Station, Antarctica (PAL).

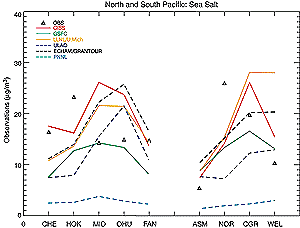
Figure 5.9: Observed and model-predicted annual average concentrations of sea salt (as Na) (in µgm-3) at a series of stations in the North and South Pacific. The models are listed in Table 5.8. Data were provided by D. Savoie and J. Prospero (University of Miami). Stations refer to: Cheju, Korea (CHE); Hedo, Okinawa, Japan (HOK); Midway Island (MID); Oahu, Hawaii (OHU); Fanning Island (FAN); American Samoa(ASM); Norfolk Island (NOR); Cape Grim, Tasmania (CGR); and Wellington/Baring Head, New Zealand (WEL).

For dust the model-observation comparison showed a better agreement with surface observations in the Northern than in the Southern Hemisphere. For example, the average absolute error in the Northern Pacific was 179%, while it was 268% in the Southern Pacific. In the Southern Hemisphere, almost all models predict concentrations higher than the observations at all stations poleward of 22°S. Thus, it appears that dust mobilisation estimates may be too high, particularly those for Australia and South America. The paucity of dust from these regions relative to other arid dust source areas has been noted previously (Prospero et al., 1989; Tegen and Fung, 1994; Rea, 1994), and may reflect the relative tectonic stability, low weathering rates, duration of land-surface exposure, and low human impacts in this area.

Table 5.9a: Comparison of models and observations of aerosol species at selected surface locations ( µg/m3)a,b.
Model
Sulphate
Black carbon
Organic carbon
Dust
Sea salt
Average
bias
(µg/m3)
Average
absolute
error
(µg/m3)
Average
bias
(µg/m3)
Average
absolute
error
(µg/m3)
Average
bias
(µg/m3)
Average
absolute
error
(µg/m3)
Average
bias
(µg/m3)
Average
absolute
error
(µg/m3)
Average
bias
(µg/m3)
Average
absolute
error
(µg/m3)
GISS
0.15
0.33
0.16
0.61
0.69
1.52
5.37
5.37
3.90
11.94
GSFC
-0.10
0.28
0.71
1.00
0.71
1.57
-0.5
1.98
-3.02
9.23
Hadley
-0.54
0.55
0.74
1.18
   
-2.47
3.48
   
CCM/Grantour
-0.31
0.40
-0.18
0.50
-0.84
1.20
1.77
2.99
5.26
14.48
ECHAM
0.09
0.42
0.74
1.07
1.52
2.09
       
Stochem
0.34
0.40
               
ULAQ
0.18
0.34
-0.30
0.48
-0.47
1.43
1.82
3.69
0.81
12.57
Mozart
0.05
0.39
-0.34
0.51
           
ECHAM/Grantour
0.26
0.28
0.07
0.55
-0.57
1.40
5.2
5.27
2.07
10.55
TM3
0.27
0.47
               
PNNL
-0.04
0.28
0.16
0.64
0.79
1.50
-2.48
2.64
-13.46
13.74
Average of all models
0.03
0.38
0.20
0.73
0.26
1.53
2.73
3.86
-0.74
12.09
a Aerosol sulphate, dust and sea salt were compared to observations at a selection of marine locations. The observations for organic carbon and black carbon were those compiled by Liousse et al. (1996) and Cooke et al. (1999).
b The average bias and the average absolute error is the average differences between each model result and the observations over all stations.

Table 5.9b: Comparison of models and observations of aerosol species at selected surface locations (%)a,b.
Model
Sulphate
Black carbon
Organic carbon
Dust
Sea salt
Average
bias
(%)
Average
absolute
error
(%)
Average
bias
(%)
Average
absolute
error
(%)
Average
bias
(%)
Average
absolute
error
(%)
Average
bias
(%)
Average
absolute
error
(%)
Average
bias
(%)
Average
absolute
error
(%)
GISS
26
31
85
127
91
121
121
121
37
40
GSFC
7
15
189
219
109
134
39
42
21
30
Hadley
-11
16
140
220
           
CCM/Grantour
1
15
43
111
13
85
78
80
63
68
ECHAM
32
35
253
276
276
285
       
Stochem
30
34
               
ULAQ
10
17
-10
84
23
100
21
35
81
88
Mozart
28
31
164
211
           
ECHAM/Grantour
31
31
204
230
88
135
70
70
29
33
TM3
43
46
               
PNNL
17
21
75
133
189
220
   
-12
16
Average of all models
19
26
127
179
112
154
66
70
36
46
a Aerosol sulphate, dust and sea salt were compared to observations at a selection of marine locations. The observations for organic carbon and black carbon were those compiled by Liousse et al. (1996) and Cooke et al. (1999).
b The average bias and the average absolute error is the average percentage differences between each model result and the observations over all stations.

Continued on next page


Other reports in this collection