5.2.5 Trends in Aerosols
The regional nature of aerosols makes tropospheric aerosol trends more difficult
to determine than trends in long-lived trace gases. Moreover, there are few
long-term records of tropospheric aerosols (SAR). Ice cores provide records
of species relevant to aerosols at a few locations. As shown in Figure
5.4, ice cores from both Greenland and the Alps display the strong anthropogenic
influence of sulphate deposited during this century (Döscher et al., 1995;
Fischer et al., 1998). Carbonaceous aerosols also show long-term trends (Lavanchy
et al., 1999). Sulphate in Antarctic ice cores shows no such trend (Dai et al.,
1995) since its source in the Southern Hemisphere is primarily natural.
Aerosols have been measured from balloon sondes at Wyoming since 1971. For
the number of aerosols larger than 0.15 mm, decreasing trends of -1.8 ±
1.4%/yr and -1.6 ± 1.8%/yr (90% confidence limits) were found in the
2.5 to 5 and 5 to 10 km altitude ranges, respectively (Hofmann, 1993). The total
number of particles increased by 0.7 ± 0.1%/yr at Cape Grim from 1977
to 1991 but the number of particles large enough to nucleate cloud droplets
(CCN) decreased by 1.5 ± 0.3%/yr from 1981 to 1991 (Gras, 1995). There
are also some long-term data on visibility and turbidity. For example, summertime
visibility in the eastern United States was worst in the 1970s, which was also
a time of maximum SO2 emissions (Husar and Wilson, 1993).
|
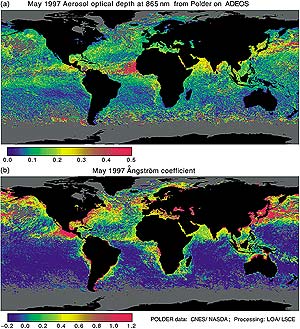
Figure 5.3: (a) Aerosol optical
depth and (b) Ångström exponent
from POLDER satellite data for May 1997 (Deuzé et al., 1999).
The largest optical depths over the Atlantic Ocean are from north
African dust. The Ångström exponent expresses the wavelength
dependence of scattered light between 670 and 865 nm. The African
dust plume has a small Ångström exponent due to the importance
of coarse mode aerosols whereas the larger Ångström exponents
around the continents show the importance of accumulation mode aerosols
in those locations.
|
|
|
Figure 5.4: (a) Sulphate concentrations
in several Greenland ice cores and an Alpine ice core (Fischer et
al., 1998; Döscher et al., 1995). Also shown are the total
SO2 emissions from sources from the US and Europe (Gschwandtner
et al., 1986; Mylona, 1996). The inset shows how peaks due to major
volcanic eruptions have been removed by a robust running median
method followed by singular spectrum analysis.
(b) Black carbon and organic carbon concentrations
in alpine ice cores (Lavanchy et al., 1999).
|
|