2.6 Are the Atmospheric/Oceanic Circulations Changing?
2.6.1 Background
Changes or fluctuations in atmospheric and oceanic circulation
are important elements of climate. Such circulation changes are the main cause
of variations in climate elements on a regional scale, sometimes mediated by
parallel changes in the land surface (IPCC, 1990, 1996). ENSO and NAO are such
examples. On decadal time-scales, the Pacific Decadal Oscillation (PDO) and
the related Inter-decadal Pacific Oscillation (IPO) may account for approximately
half the global mean variation in surface temperatures. They are also prominently
linked to regional variations in temperature and precipitation (Higgins et al.,
2000). This section documents regional changes and slow fluctuations in atmospheric
circulation over past decades, and demonstrates that these are consistent with
large-scale changes in other variables, especially temperature and precipitation.
Note that there is much evidence that many of the atmospheric circulation changes
we observe, particularly in the extra-tropics, are the net result of irregular
fluctuations between preferred states of the atmosphere (Palmer, 1993, 1999)
that last for much shorter times. Thus changes in circulation on decadal time-scales
involve changes in the frequency of such states. Chapter 7
discusses this in more detail. The focus of this section is on long-term variation
and change, rather than on shorter-term variability.
2.6.2 El Niño-Southern Oscillation and Tropical/Extra-tropical
Interaction
ENSO is the primary global mode of climate variability in the 2 to 7 year time
band. El Niño is defined by SST anomalies in the eastern tropical Pacific
while the Southern Oscillation Index (SOI) is a measure of the atmospheric circulation
response in the Pacific-Indian Ocean region. This sub-section assesses the variability
of ENSO over the past few centuries.
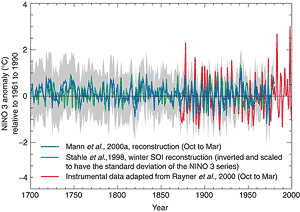
Figure 2.28: Reconstructions since 1700 of proxy-based ENSO indices.
Shown are the Northern Hemisphere cold-season (Oct-Mar) mean NINO 3 index
of Mann et al. (2000a) and the Northern Hemisphere winter SOI index of Stahle
et al. (1998). The SOI series is scaled to have the same standard deviation
as the NINO 3 index, and is reversed in sign to be positively correlated
with the NINO 3 series. An instrumental NINO 3 index from 1871 to 2000 is
shown for comparison (Rayner et al., 2000; see also Figure
2.29), with two standard error limits (grey shaded) of the proxy NINO
3 reconstruction. |
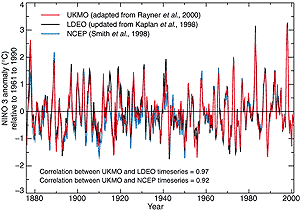
Figure 2.29: El Niño-La Niña variations from 1876 to 2000
measured by sea surface temperature in the region 5°N to 5°S, 150
to 90°W. Reconstructions using pattern analysis methods from (a) red:
UK Met Office (UKMO) Hadley Centre sea ice and sea surface temperature data
set version 1 (Rayner et al., 2000); (b) black: from the Lamont-Doherty
Earth Observatory (LDEO) (Kaplan et al., 1998); (c) blue: the National Centers
for Environmental Prediction (NCEP) analysis (Smith et al., 1998). 1876
is close to the earliest date for which reasonably reliable reconstructions
can be made. |
Multiproxy-based reconstructions of the behaviour of ENSO have recently been
attempted for the past few centuries, including a boreal winter season SOI reconstruction
based on highly ENSO-sensitive tree-ring indicators (Stahle et al., 1998). A
multiproxy-based reconstruction of the boreal cold-season (Oct-Mar) NINO 3 (SST
anomalies in the tropical Pacific from 5°N to 5°S, 150°W to 90°W)
index (Mann et al., 2000b) has also been made. Figure
2.28 compares the behaviour of these two series with recent ENSO behaviour.
The SOI reconstruction has been rescaled to have the sign and variance of the
NINO 3 reconstruction; the two reconstructions, based on independent methods
and partially independent data, have a linear correlation (r=0.64) during the
pre-calibration interval. While the estimated uncertainties in these reconstructed
series are substantial, they suggest that the very large 1982/83 and 1997/98
warm events might be outside the range of variability of the past few centuries.
However, the reconstructions tend to underestimate the amplitude of ENSO events,
as is clearly evident for the large 1877/78 event. Only a richer network of
ENSO-sensitive proxy indicators can improve this situation, such as the new
long tropical coral series becoming available (see Dunbar and Cole, 1999).
Instrumental records have been examined to search for possible changes in ENSO
over the past 120 years. Three new reconstructions of SST in the eastern Equatorial
Pacific (Figure 2.29) that use optimum interpolation
methods exhibit strong similarities. The dominant 2 to 6 year time-scale in
ENSO is apparent. Both the activity and periodicity of ENSO have varied considerably
since 1871 with considerable irregularity in time. There was an apparent shift
in the temperature of the tropical Pacific around 1976 to warmer conditions,
discussed in the SAR, which appeared to continue until at least 1998. During
this period ENSO events were more frequent, intense or persistent. It is unclear
whether this warm state continues, with the persistance of the long La Niña
from late 1998 until early 2001. ENSO has been related to variations of precipitation
and temperature over much of the tropics and sub-tropics, and some mid-latitude
areas.
A number of recent studies have found changes in the interannual variability
of ENSO over the last century, related in part to an observed reduction in ENSO
variability between about 1920 and 1960. Various studies (Wang and Wang, 1996;
Torrence and Compo, 1998; Torrence and Webster, 1998; Kestin et al., 1999) show
more robust signals in the quasi-biennial and ‘classical 3 to 4 year
ENSO bands (3.4 and 7 years) during the first and last 40 to 50 years of the
instrumental record. A period of very weak signal strength (with a near 5-year
periodicity) occurs in much of the intervening epoch.
The 1990s have received considerable attention, as the recent behaviour of
ENSO seems unusual relative to that of previous decades. A protracted period
of low SOI from 1990 to 1995, during which several weak to moderate El Niño
events occurred with no intervening La Niña events (Goddard and Graham,
1997) was found by some studies (e.g., Trenberth and Hoar, 1996) to be statistically
very rare. Whether global warming is influencing El Niño, especially
given the remarkable El Niño of 1997/98, is a key question (Trenberth,
1998b), especially as El Niño affects global temperature itself (Section
2.2 and Chapter 7).